

Innovation is at the heart of the energy transition to a carbonfree world. Breakthroughs in renewable energy technologies have accelerated their deployment by reducing their costs and improving their performance.
Technology breakthroughs can be reflected in patent filings, so IRENA has developed a database of INternational Standards and Patents In Renewable Energy (INSPIRE) to track them. The patterns of patent filing over time offer interesting insights into where renewable energy technologies, including biofuel technologies, are headed. Liquid biofuels and biomethane accounted for just 4% of in total renewable energy supplied in 2015. But the share could nearly triple to 11% by 2050 if cost-effective options identified in IRENA’s Renewable Energy Roadmap, REmap, are put in place. Even with anticipated electrification of passenger vehicle fleets, there will be an urgent need for biofuels in aviation, marine shipping and heavy freight transport, which together represent nearly a third of transport fuel demand, to decarbonize the global economy and limit global temperature rise. Liquid biofuel demand could expand about 7-fold to some 900 billion litres per annum by 2050. Nearly half of this total amount could come from advanced processes for conversion of cellulosic feedstocks, which supply just 1% of biofuels today.
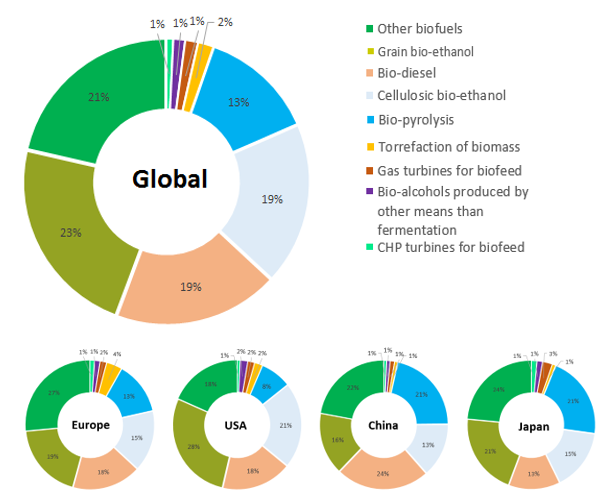
Continuous innovation in biofuels production will thus be essential. Of the more than half a million patents in renewable energy that have been filed to date, 15% are for bioenergy and 9% specifically for biofuels. Using the patent classification developed by the European Patent Office (EPO), INSPIRE indicates which types of biofuel technology have the most patent activity. As shown in Figure 1, the bulk of patents have been filed for grain bio-ethanol, cellulosic bio-ethanol, bio-diesel, and biopyrolysis. Globally, just under a third of patent filings could be said to relate mainly to conversion of lignocellulosic feedstocks, summing cellulosic ethanol (19%, in light blue colour in Figure 1) and bio-pyrolysis (13%, in sky blue). Patent filings related to the chief conventional biofuels, grain bioethanol (23%, in olive) and biodiesel (19%, in tan) sum to over two-fifths of the total.
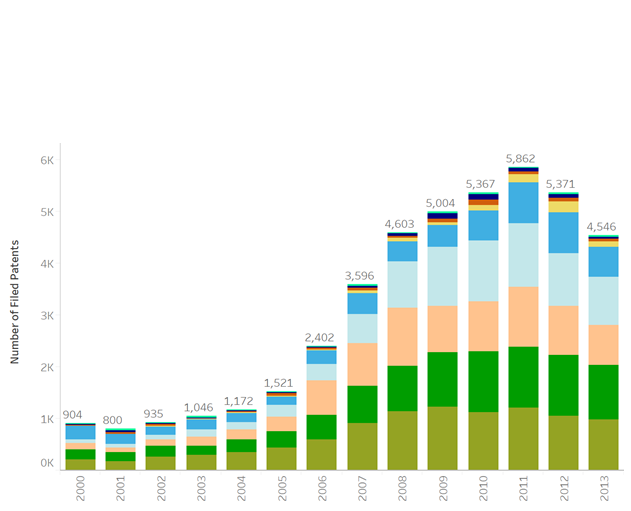
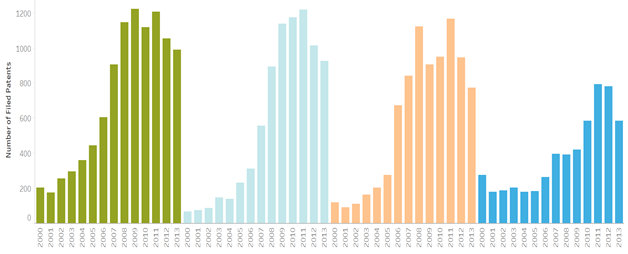
Europe (EU-28), China, Japan and the United States are the front runners in biofuels patent activity. They all have diversified portfolios, but each has a somewhat different emphasis. The United States has given greater weight to bioethanol, both grain-based and cellulosic. China, in contrast, has placed more emphasis on biodiesel and biopyrolysis. Europe has focused more on conventional biofuels, namely grain bioethanol and bio-diesel. As shown in Figure 2, biofuel patent filings peaked in 2011. Filings for cellulosic bioethanol, biodiesel and grain bioethanol grew more than 10% per annum in the decade from 2000. Patent filings for torrefaction of biomass grew fastest, with an annual growth rate of 26%, but remain small in absolute terms. Filings related to heat and power production from biofuels (CHP and gas turbines for biofeed) grew more slowly.
Source: based on http://inspire.irena.org/
Note: The last four years are not shown due to lag in the data between the patent applications and patent approvals.
Since the peak, a drop in the patents filings can be observed. This may be linked to the recent sharp decline in biofuel investment, from $25 billion in 2007 to $5 billion in 2013. Investment and market growth spurs technology research and development, so with less investment, it is reasonable to expect fewer patents.
Different organisations and individuals lead biofuels innovation. Getting familiar with the work and initiatives from these top runners is key, as early collaboration and knowledge sharing can support inventors and organizations that just initiated research and development work in biofuels. IRENA analysis has shown that patents filing is not exclusive to major organizations but also engages multiple small and medium-sized actors.
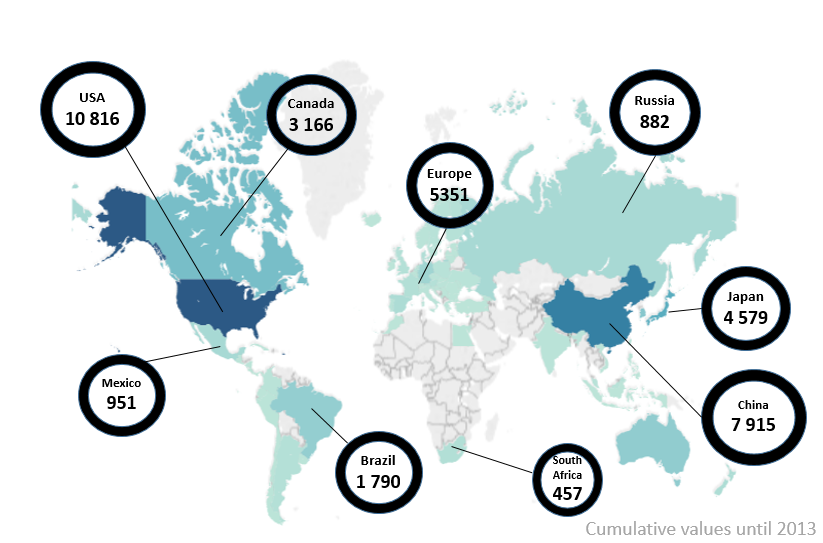
Most countries engaged in biofuel technology development are also major biofuel producers, as shown in figure 3. The countries with the most patent filings are the United States, China, Europe (EU-28), Japan, Canada and Brazil. Within Europe, Germany filed the most patents, followed by Spain, France and Italy. The countries with the most biofuels production are the United States, Europe, Brazil and China.
Source: Based on http://inspire.irena.org/
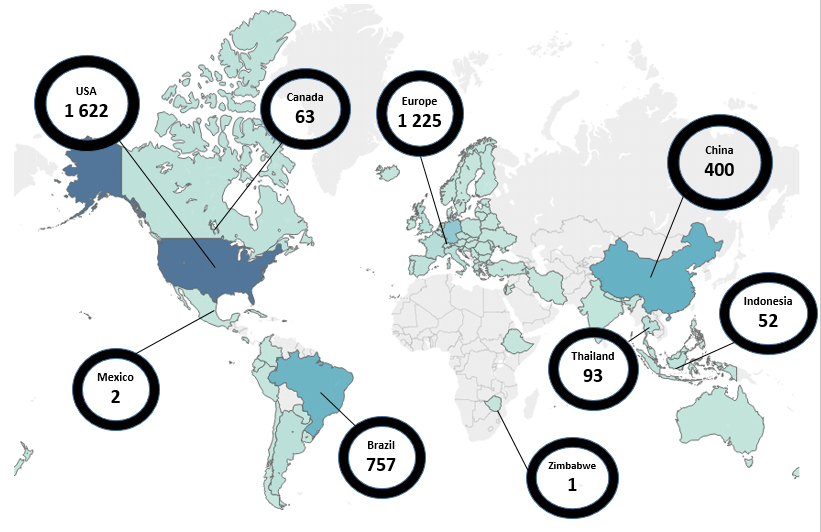
But innovation and production do not always occur in the same place. A great deal of patent activity is happening in countries that have no biofuels production, like Japan and Russia. Canada also has much more patent activity than its biofuels production might lead one to expect. In the other direction, there is little patent activity in some countries with high biofuel production such as Thailand and Indonesia. So, while patent and innovation activity is key to understanding technology development, it does not fully explain technology deployment. For example, information concerning licensing of technology patents, which could indicate potential deployment markets, is not publicly available.
The lag between technology development and deployment is also difficult to estimate and needs to be better understood. This is illustrated by the case of cellulosic bio-ethanol, a leading pathway for advanced biofuels production. It led in annual patent filing between 2005 and 2011, with an impressive compound annual growth rate (CAGR) of 65%. However, in terms of deployment it still accounts for less than 1% of liquid biofuels produced globally. It is thus of paramount important for biofuels innovation to go beyond just technology RD&D to innovation in better business models and improved market regulation.
INSPIRE- International Standards and Patents in Renewable Energy Data and charts used in this article have been gathered using the webtool INSPIRE. INSPIRE is an online tool developed by IRENA to perform analysis on patents and technical standards in renewable energy, by using the different dashboards, and to create awareness of latest trends in innovative technologies for renewable energy. INSPIRE data is based on the Y02 classification for climate change mitigation technology patents of the European Patent Office.
For further information on INSPIRE, please click here (online tutorial); to learn about Y02 classification, click here.
Text by Alessandra Salgado, Francisco Boshell, Jeffrey Skeer, Rodrigo Leme of the International Renewable Energy Agency (IRENA).